BIT-101
Bill Gates touched my MacBook Pro
I’ve alluded to the power you get when you combine two or more useful functions. Today we’ll combine norm and lerp.
The map function has a bit of a learning curve because it has five parameters to understand, but it’s one of my most used functions. Once you really get it, you’ll probably use it all the time. Best to see it, then walk through it.
func Map(srcValue, srcMin, srcMax, dstMin, dstMax) {
	t = norm(srcValue, srcMin, srcMax)
	return lerp(t, dstMin, dstMax)
}
Internally, it simply combines norm and lerp. But what a combo!
The first three parameters are the same as the parameters to norm. a value, minimum and maximum. In fact, those three parameters are fed straight into the norm function, giving back a normalized value, t. The first three parameters are the source value and range.
Then, this t value is used with the minumum and maximum values of the destination range.
Let’s walk through a simple one first.
x = map(7, 5, 10, 300, 400)
First, the function will normalize 7 in the range of 5 to 10. This is 0.4.
Then it uses 0.4 as a t value to lerp from 300 to 400. This gives us 340.
Now a more useful example. I’ve generated an array of 100 random numbers called nums. The way I’ve generated them, I don’t have any idea of the min and max values in the array. But I have a function that will go through and get these. Cool. Now I can loop through the list and get each number and map it to a value in the range of 0 to the height of the canvas, 300. This gives me the y value.
min = getMin(nums)
max = getMax(nums)

for (i = 0; i < nums.length; i++) {
    n = nums[i]
    y = map(n, min, max, 300, 0)
    x = map(i, 0, nums.length, 0, 800)
    lineto(x, y)
}
stroke()
For the x value, I can map the iterator, i with a source range of 0 to the length of the array, and a destination range of 0 to the width of the canvas.
Then I just draw a line to each new point.
Note also that instead of using the destination range of 0, 300 in the map for y, I’m using 300, 0. The great thing about norm, lerp and map is that you can flip the ranges without breaking anything. This lets the top of the canvas (zero) represent the maximum value and the bottom of the canvas (300) represent the minimum value, like you’d expect.
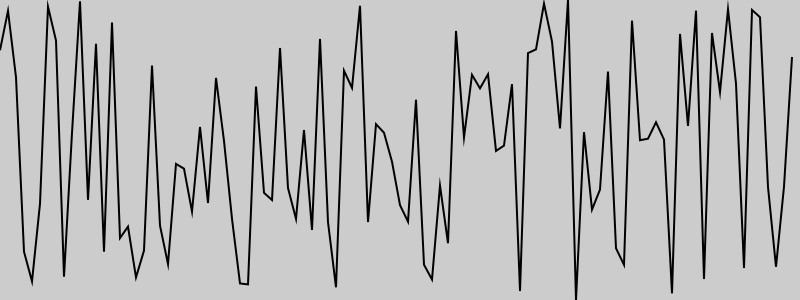
Without any math or knowledge of the values in the array, or even how long the array is, we walk away with a perfectly scaled graph of the values.
I’ll note that the map for x is trivial:
x = map(i, 0, nums.length, 0, 800)
I could have just as easily said
x = i / nums.length * 800
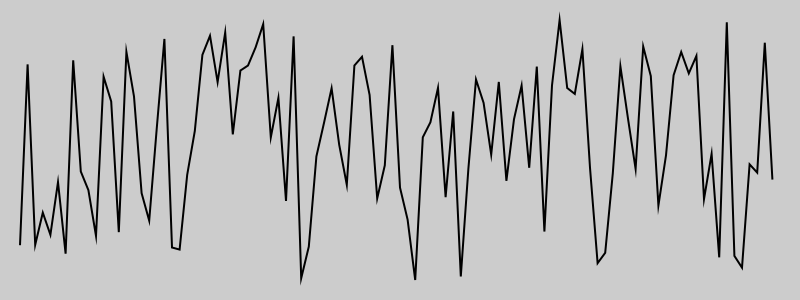
But as before, this requires me to think about math in my head, whereas using the function I just think about the input range and output range. Also, if I decide to change the dimensions or position of the graph, like putting a border around it, I can do so easily by just changing the output ranges…
y = map(n, min, max, 280, 20)
x = map(i, 0, nums.length, 20, 780)
I did a video on this function on my Coding Math Youtube channel. View it here: Coding Math Mini #3, Map