How to Draw a Line
… in code of course.
First, I’m going to assume that you are working in some kind of system that has a drawing API. But wait, even the simplest of drawing APIs have a function to draw a line already. All right then, we’ll start with that. Assuming you are using something like HTML, JS and Canvas, you’re going to do something like this:
context.moveTo(x0, y0);
context.lineTo(x1, y1);
context.stroke();
You start with two points, defined by two x, y coordinates. You move to the first one, you line to the second one, you stroke that path. And you wind up with:
Easy. And Boring. Sure you can change the width and the color and transparency, but it’s still just a boring line. In order to do a bit more with it, let’s abandon the built-in line functionality and make our own.
The idea is to start at the first point and draw a series of small squares between it and the second point. We’ll use the Pythagorean theorem to get the distance between the two points. That will let us know how many steps we have to take. Then just linearly interpolate between the x and y positions and draw a square there.
const dx = x1 - x0;
const dy = y1 - y0;
const dist = Math.sqrt(dx * dx + dy * dy);
for (let i = 0; i < dist; i++) {
let t = i / dist;
let x = x0 + dx * t;
let y = y0 + dy * t;
context.fillRect(x - 0.5, y - 0.5, 1, 1);
}
And the result of that:
Not half bad really. Of course, if you want to have a really fast and more accurate line drawing routine, you’d probably want to go with Bresenham’s algorithm or maybe Wu’s algorithm. Honestly, I’m really just referencing them so people don’t comment to correct me and tell me I should be using them. But we’re just getting started here. This still isn’t any more interesting than the built-in line function. It’s just too straight, too even, to regular. Let’s mix it up a bit.
We can start by changing the increment from i++ to, say, i += 5, and get:
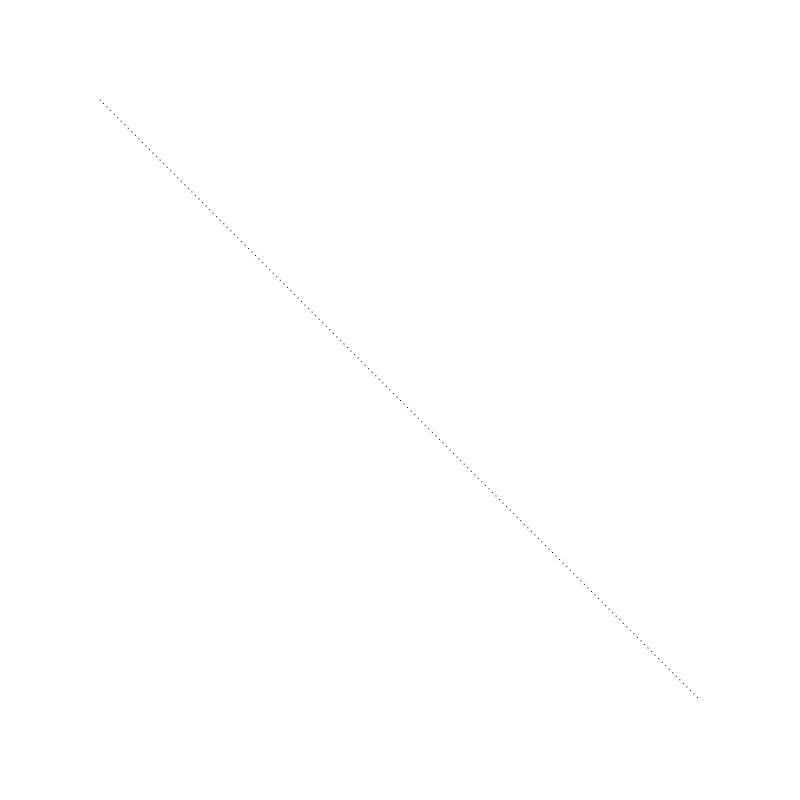
Now we have some space between each “pixel” that makes up the line. We can then increase the size of these “pixels”:
context.fillRect(x - 1.5, y - 1.5, 3, 3);
Which has the general effect of pixel art:

In the next example, I changed the increment to 8 and used the following code to draw a circle instead of a square:
context.beginPath();
context.arc(x, y, 4, 0, Math.PI * 2);
context.fill();
And got:
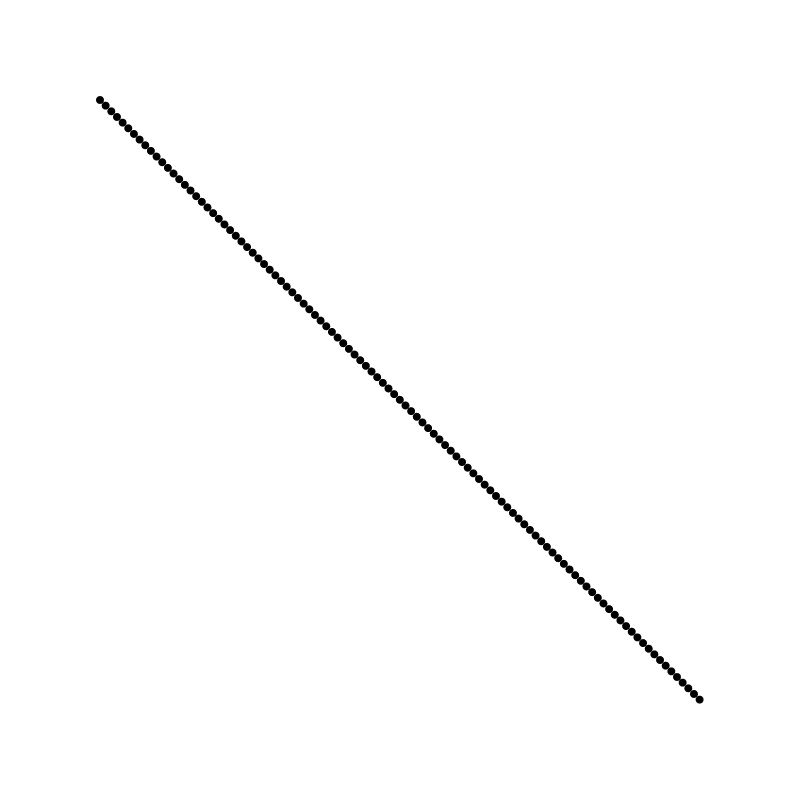
You can keep playing with this, making lines out of any shapes with any amount of spacing. But let’s throw in some randomness.
Instead of drawing a pixel at every single point along the line, let’s draw them at random positions along the line. We can do that just by making t a random value from 0 to 1. Altering the first version, we get:
for (let i = 0; i < dist; i++){
  let t = Math.random();
  let x = x0 + dx * t;
  let y = y0 + dy * t;
  context.fillRect(x - 0.5, y - 0.5, 1, 1);
}
And an image that will look something like this:

Now we’re getting something a bit more interesting.
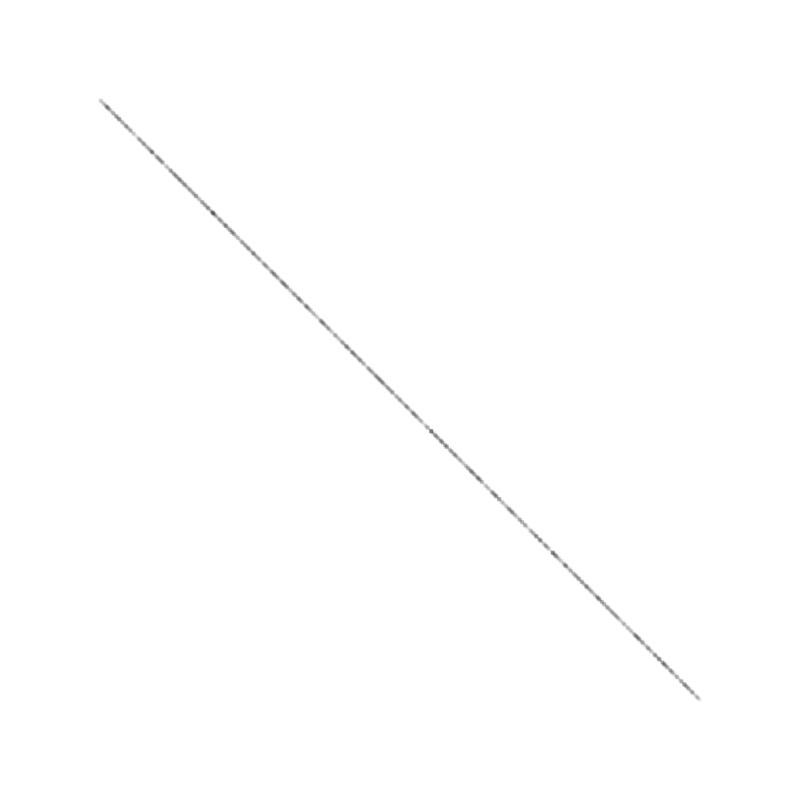
Let’s play with size and transparency next. I’ll make a size variable that will let us easily change the size of each pixel. And then set the transparency down real low. This will let the pixels overlap and build up more gradually in different areas. I’ll also use dist*2 as the pixel count, which gives us a lot more pixels to play with.
const size = 4;
context.fillStyle = "rgba(0, 0, 0, 0.05)";
for (let i = 0; i < dist*2; i++){
let t = Math.random();
let x = x0 + dx * t;
let y = y0 + dy * t;
context.fillRect(x - size / 2, y - size / 2, size, size);
}
And that gives us:
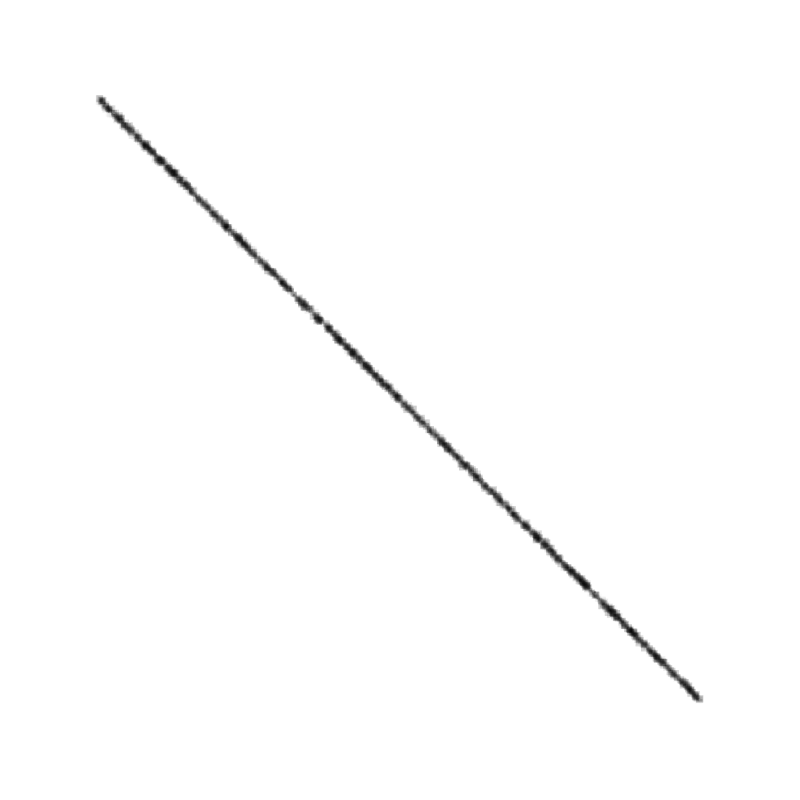
Finally, lets go all out, add even more pixels, vary the size, vary the transparency, even vary the position of each individual pixel.
for (let i = 0; i < dist*4; i++){
  let t = Math.random();
  let x = x0 + dx * t;
  let y = y0 + dy * t;
  x += Math.random() * 4 - 2;
  y += Math.random() * 4 - 2;
  let size = Math.random() * 8;
  context.fillStyle = "rgba(0,0,0, " + Math.random()*0.2 + ")";
  context.fillRect(x - size / 2, y - size / 2, size, size);
}
Now we have something that looks kind of like ink on wet paper.
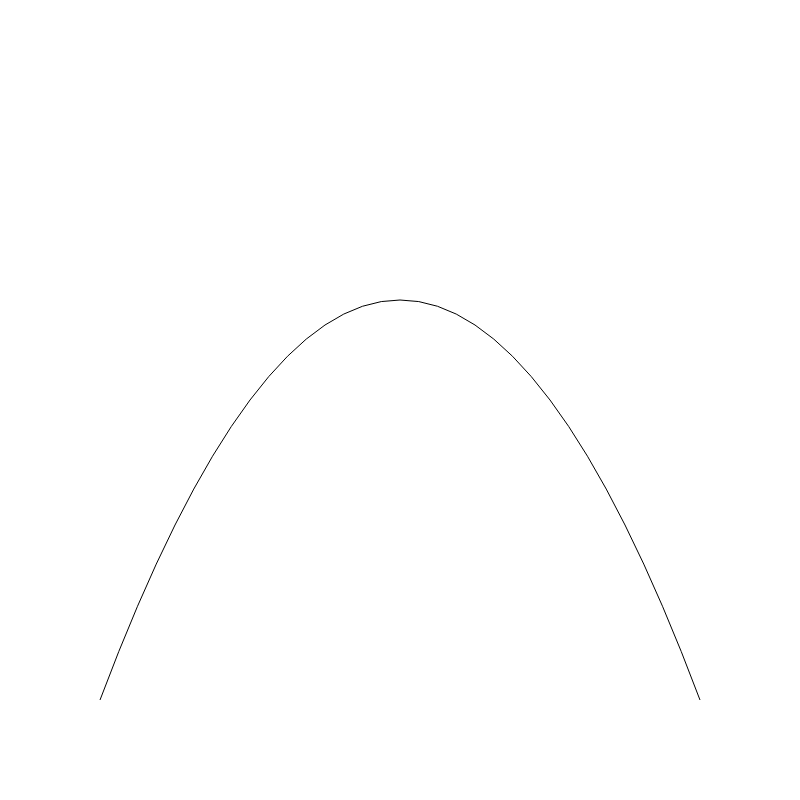
But we don’t have to limit it to straight lines. Here’s the built-in code for drawing a quadratic curve – defined by three points:
const x0 = 100;
const y0 = 700;
const x1 = 400;
const y1 = -100;
const x2 = 700;
const y2 = 700;
context.beginPath();
context.moveTo(x0, y0);
context.quadraticCurveTo(x1, y1, x2, y2);
context.stroke()
This gives you a bland curve:
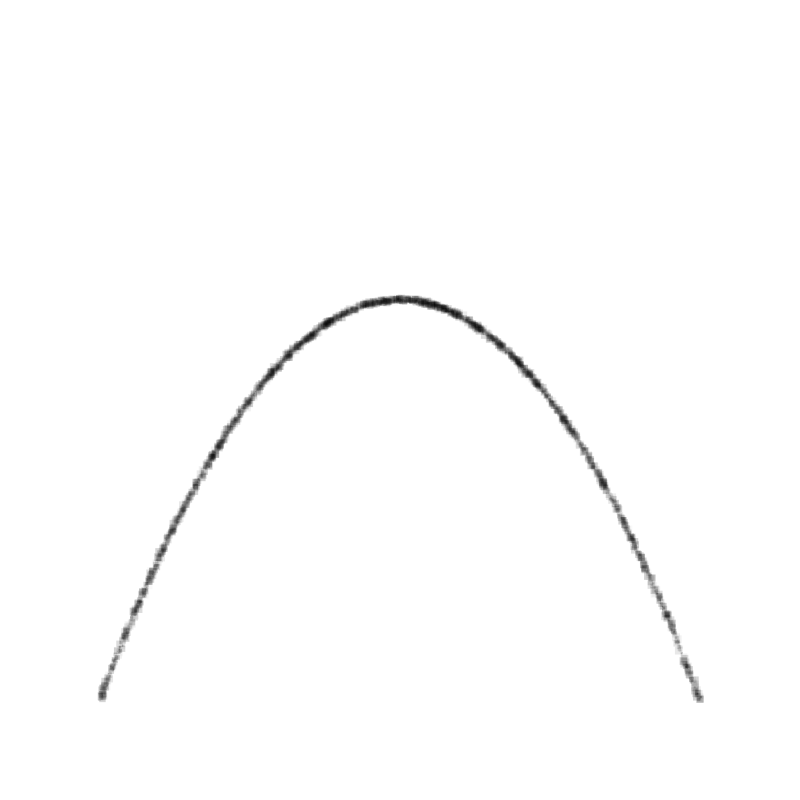
But we can apply the same concept here. We’ll need a function that gives us a point somewhere along the curve. Fortunately, such a function is well known. We can again choose a random t value and start drawing random pixels. Here’s the code – note I chose an arbitrary value of 3000 for number of pixels. Use more or less to get a denser or lighter line.
for (let i = 0; i < 3000; i++){
  let t = Math.random();
  let p = quadraticPoint(x0, y0, x1, y1, x2, y2, t);
  x = p.x + Math.random() * 4 - 2;
  y = p.y + Math.random() * 4 - 2;
  let size = Math.random() * 8;
  context.fillStyle = "rgba(0,0,0, " + Math.random()*0.2 + ")";
  context.fillRect(x - size / 2, y - size / 2, size, size);
}
function quadraticPoint(x0, y0, x1, y1, x2, y2, t) {
const oneMinusT = 1.0 - t;
const m0 = oneMinusT * oneMinusT;
const m1 = 2.0 * oneMinusT * t;
const m2 = t * t;
return {
x: m0 * x0 + m1 * x1 + m2 * x2,
y: m0 * y0 + m1 * y1 + m2 * y2,
}
}
And the curve:
This looks even better drawn with circles:

This looks interesting all by itself, but I suggest you create some parameterized functions for drawing lines, curves and shapes like this and see if it doesn’t change the overall look of your creative pieces.
The whole series of How to Draw a Line:
Comments? Best way to shout at me is on Mastodon ![]()